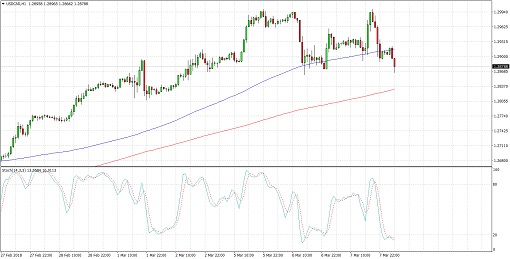
USDCAD formed a double top reversal pattern on its 1-hour time frame, signaling that the rally could be over. Price has yet to break below the neckline at 1.2865 to confirm the potential selloff. The chart pattern is approximately 140 pips tall so the resulting breakdown could be of the same height.
The 100 SMA is still above the longer-term 200 SMA, though, so the path of least resistance is to the upside. This suggests that the uptrend is more likely to continue than to reverse. Stochastic is indicating oversold conditions, which means that sellers are exhausted and buyers could take over.
In this case, price could still bounce off the neckline support to form another top at the 1.3000 area or perhaps even break higher to indicate a continuation of the longer-term rally.
The US dollar rebounded against most of its rivals in the latest US session on reports that the Trump administration could give exemptions to Canada and Mexico when it comes to higher trade tariffs on steel and aluminum. However, NAFTA negotiations are still ongoing so Canada’s trade sector could still face risks.
This was highlighted in the latest BOC decision, during which the central bank kept rates unchanged as expected but cited uncertainties coming from Trump policies. Still, policymakers cited that the labor market is tightening and that inflation is running close to their 2% target.

The Loonie also drew support from a smaller than expected build in US EIA crude oil stockpiles even as Baker Hughes has been reporting consecutive gains in oil rig counts. Both Canada and the US are set to print their jobs reports on Friday and this could determine where USDCAD could be headed next.
By Kate Curtis from Trader’s Way

