
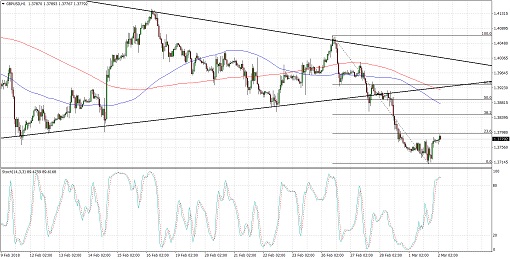
GBPUSD broke below the bottom of its symmetrical triangle on the 1-hour time frame to signal that a downtrend is underway. Price is bouncing off the 1.3700 area, though, so a pullback might take place before the selloff gains traction.
Applying the Fib tool on the latest swing high and low shows that the 50% level is close to the broken triangle support around the 1.3900 major psychological mark. This is also around the 100 SMA dynamic resistance.
Speaking of moving averages, the 100 SMA is below the longer-term 200 SMA to signal that the path of least resistance is to the downside. Stochastic is also indicating overbought conditions and turning lower could draw more sellers back in.
Sterling has been taking a heavy beating after the EU released its draft agreement on the post-Brexit relationship with the UK. EU officials insist on a common regulatory area at the border with Northern Ireland, something that UK officials have been opposing.
UK manufacturing PMI fell from 55.3 to 55.2, slightly better than the projected 55.1 figure, and the construction PMI is due today. However, the focus could be on PM May’s speech as she is expected to share her thoughts on the EU draft agreement.
Meanwhile, the dollar is also on weak footing after Trump announced his plans to impose higher tariffs on steel and aluminum as this sparked trade war fears. Data from the US was mostly better than expected, though, with the ISM manufacturing PMI up from 59.1 to 60.8 versus the 58.7 forecast.
By Kate Curtis from Trader’s Way