
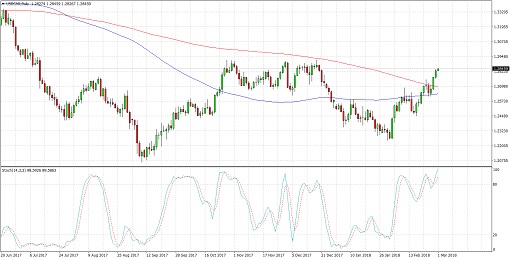
USDCAD is forming another major reversal pattern, this time on its daily time frame. Price has yet to test the neckline around the 1.2900 major psychological level and break above it to confirm the potential uptrend.
The chart pattern spans around 850 pips in height so the resulting climb could be of the same height. The 100 SMA is below the longer-term 200 SMA to signal that the path of least resistance is to the downside, but the gap is narrowing to signal that an upward crossover is underway.
Stochastic is already indicating overbought conditions, which means that buyers are starting to feel exhausted. Turning lower could draw sellers back in and lead to a quick pullback.
Economic data from the US was mostly weaker than expected once more but the safe-haven Greenback managed to outpace its higher-yielding peers on account of risk aversion. Apart from that, new Fed head Powell’s speech earlier in the week was more hawkish than expected as he highlighted factors supporting upside risks for the US economy.
Meanwhile, the Loonie was bogged down by falling oil prices resulting from a stronger dollar and a larger than expected build in stockpiles. The EIA reported an increase of 3 million barrels versus the estimated gain of 2.4 million barrels, and the recent Baker Hughes report showed more gains in oil rigs.
US core PCE price index is due today and a 0.3% uptick is eyed, slightly stronger than the earlier 0.2% increase. Personal spending and income numbers are also lined up, along with the ISM manufacturing PMI, which is expected to dip from 59.1 to 58.7.
By Kate Curtis from Trader’s Way