
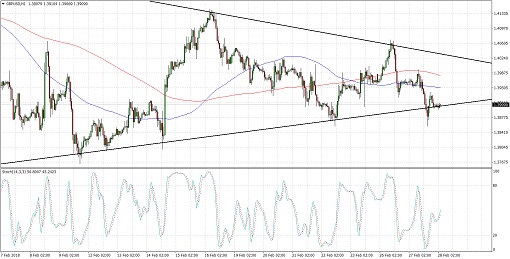
GBPUSD has formed lower highs and higher lows, creating a symmetrical triangle pattern on its 1-hour time frame. Price is currently testing support and might be due for a bounce soon.
Stochastic is on the move up to signal that buyers are regaining the upper hand and could take the pair back up to the resistance at 1.4025. However, the 100 SMA is below the longer-term 200 SMA to show that selling pressure is present.
In that case, a break below the triangle support could happen and lead to a selloff for the pair. The chart pattern spans around 450 pips in height so the resulting breakdown could be of the same size.
Economic data from the US was mostly weaker than expected yesterday as durable goods orders data and the goods trade balance fell short of estimates. However, the dollar got a boost when new Fed Chairperson Powell gave his testimony and added a few more hawkish remarks that supported tightening expectations.
As for the pound, the downbeat outlook shared by Moody’s UK Brexit Monitor weighed on the currency. “Consumer indicators are below five-year averages and household consumption growth has slowed since the Brexit referendum in June 2016. Lacklustre retail sales fell further below their five-year trend in January,” the report noted.
There are no major reports due from the UK economy today while the US has its preliminary GDP up for release. Analysts are expecting a downgrade from 2.6% to 2.5% while the preliminary GDP price index could stay unchanged. Chicago PMI and pending home sales are also due.
By Kate Curtis from Trader’s Way