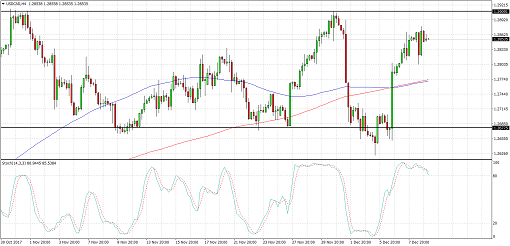
USDCAD is still trading sideways, finding resistance at 1.2900 and bouncing off support at 1.2675 on the latest test. Price is now nearing the top of the range once more and technical indicators are signaling the resistance might hold.
The 100 SMA is below the longer-term 200 SMA, so the path of least resistance is to the downside. This means that the ceiling is more likely to hold than to break. Stochastic is also indicating overbought conditions and is starting to turn lower, reflecting a return in bearish pressure.
However, if an upside breakout occurs, price could head up by around 225 pips or the same height as the range. Similarly, a downside break could lead to a selloff of the same height.
There are plenty of top-tier catalysts lined up from the US economy this week, but the main event is likely the FOMC decision. Although a December hike is priced in, traders are more eager to find out how the pace of tightening might go in 2018. The Fed is slated to release its updated economic projections and this would give clues next year’s rate hikes.
The US is also set to release its latest batch of inflation and consumer spending figures. Note that policymakers signaled a weaker inflation outlook a couple of weeks back, and this might be reflected in the PPI and CPI reports.
There’s not much in the way of top-tier data from Canada but the Loonie is on weak footing owing to the less hawkish statement from the BOC last week. Oil prices could also influence the positively correlated currency from here.
By Kate Curtis from Trader’s Way