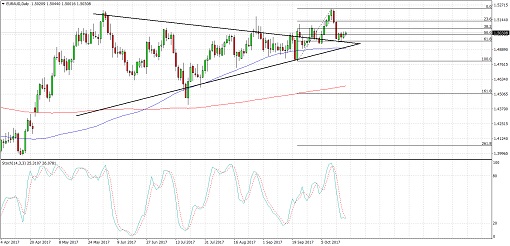
EURAUD recently broke out of its symmetrical triangle formation on the daily time frame to indicate that bullish momentum is getting stronger. Price reached a high of 1.5246 before turning back down for a retest of the broken triangle resistance.
Applying the Fibonacci retracement tool on the latest swing low and high shows that the 61.8% level lines up with the broken triangle resistance that might hold as support. The 100 SMA is also close to these Fib levels, acting as an extra layer of defense, and is above the longer-term 200 SMA to signal that the climb is more likely to resume than to reverse.
The gap between the moving averages is getting wider to indicate strengthening bullish momentum. However, stochastic still has room to fall so there may still be some bearish pressure left for a larger correction.
Economic reports from China came in mostly in line with expectations, which appears to have been bullish for the Aussie. Industrial production and retail sales came in slightly better than expected, signaling stronger demand for Australian commodity products.
Meanwhile, the political uncertainties in Europe continue to weigh on the shared currency. Catalonia has said that it will declare independence if Spain takes away its autonomy, but it is not clear how this situation might play out. Meanwhile, the polls in Austria also signal a leaning towards the far-right political leadership.
There hasn’t been much in the way of top-tier data from the euro zone yesterday and today so the shared currency could continue to be driven by market sentiment and political developments. As for Australia, its freshly released jobs report printed stronger than expected results of 19.8K in employment gains and a drop in the unemployment rate from 5.6% to 5.5%.
By Kate Curtis from Trader’s Way