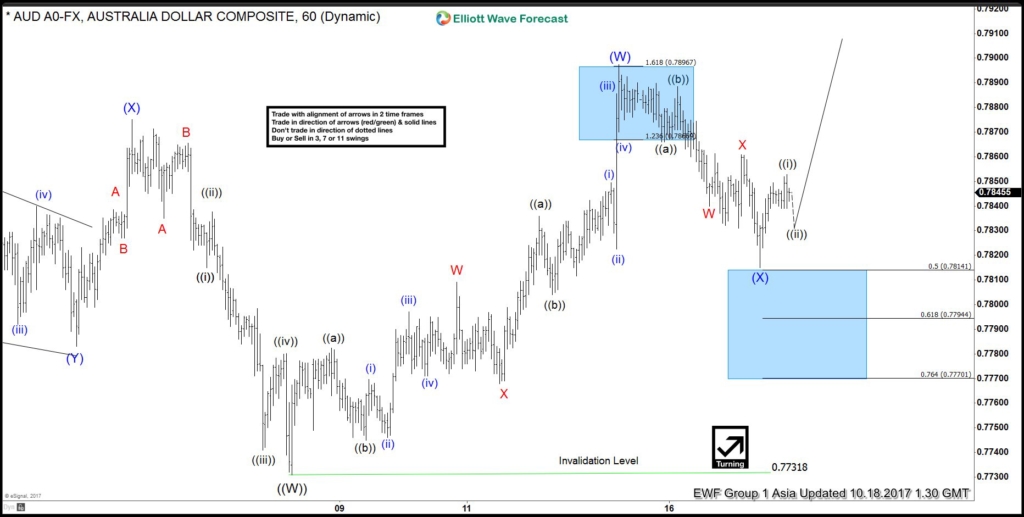
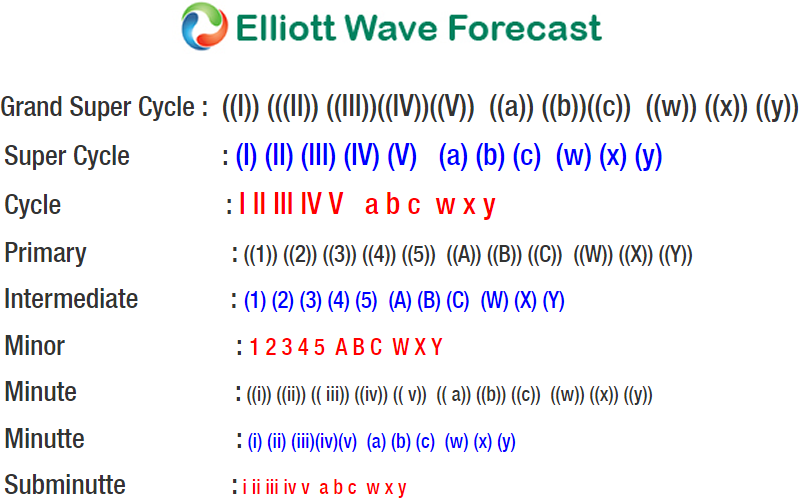
AUDUSD Elliott Wave structure suggests that the decline to 0.7731 on October 6th low ended Primary wave ((W)). From there, Primary wave ((X)) bounce is unfolding as a double three Elliott Wave structure. Rally to 0.7807 ended Intermediate wave (W) of ((X)) and pullback to 0.7815 ended Intermediate wave (X) of ((X)). A break above Intermediate wave (W) at 0.7815 will give more validity to this view. Until then, a double correction in Intermediate wave ((X)) is still possible. Near term, while pullbacks stay above 0.7815, but more importantly above 10/6 low at 0.7731, expect pair to extend higher.
AUDUSD 1 Hour Elliott Wave Chart
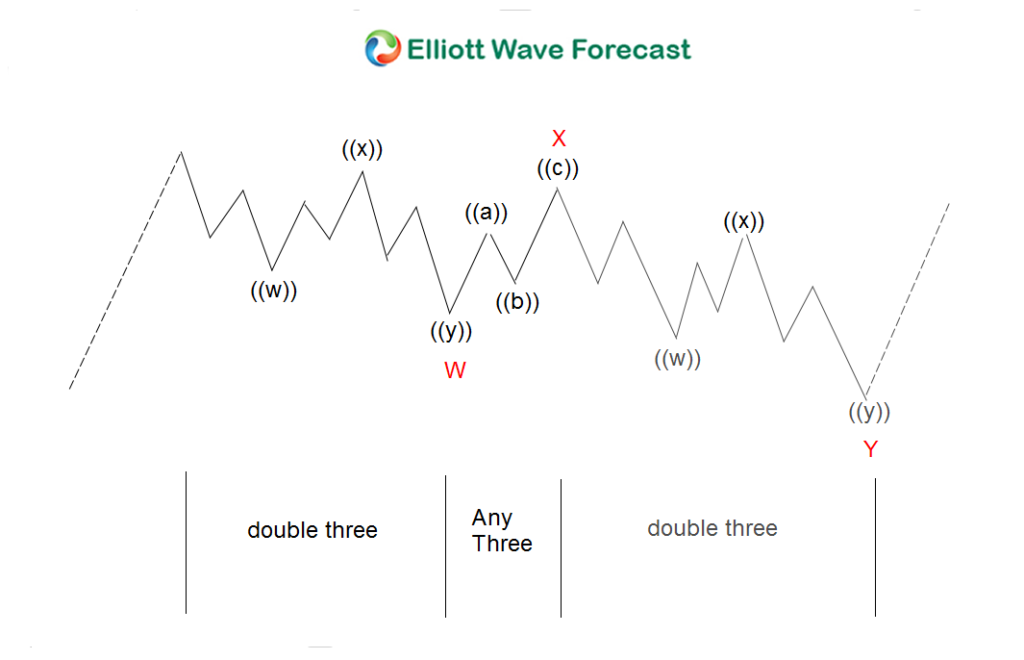
Double three ( 7 swings) is a common corrective pattern in Elliott wave’s theory. Another name for Double three is a 7-swing structure. It is a very reliable pattern that gives traders a good opportunity to trade with a well-defined level of risk and target areas. Below is the image of what what Elliott Wave Double Three looks like. It has labels of (W), (X), (Y) and an internal structure of 3-3-3. This means that all 3 legs has corrective sequences. Each (W) and (Y) is formed by 3 wave oscillations and has a structure of A, B, C or W, X, Y of smaller degrees.
Source : https://elliottwave-forecast.com/forex/audusd-elliott-wave-analysis-10-18/


