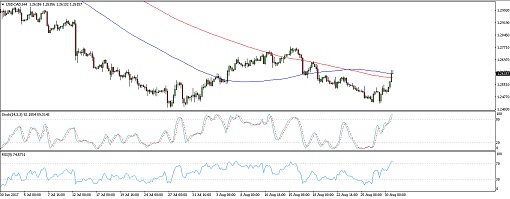
USDCAD seems to be done with its selloff as price is forming a double bottom pattern on its 4-hour time frame. This classic reversal signal could be confirmed once price breaks past the neckline resistance at the 1.2800 level.
The chart pattern is approximately 400 pips tall so the resulting rally could be of the same size. The 100 SMA has crossed above the longer-term 200 SMA to signal that the path of least resistance is to the upside, but these moving averages appear to be holding as dynamic resistance at the moment.
Stochastic is on the move up to show that buying pressure is in play so bulls might have enough energy to push for a neckline test. However, the oscillator is also nearing overbought levels to indicate rally exhaustion and a potential return in selling momentum.
Crude oil has been tumbling in the past few days due to the impact of Hurricane Harvey on refineries but got a reprieve earlier today when the EIA reported a larger than expected draw of 5.4 million barrels in crude oil stockpiles versus the estimated drop of 1.8 million barrels. This eased oversupply fears somewhat but markets still seem worried that the buildup in inventories will take its toll in the following weeks.
Meanwhile, the US dollar got a strong boost following an upbeat ADP non-farm employment change figure for August and the positive revision in the Q2 preliminary GDP reading to 3%. US President Trump also spoke about tax reform in his latest speech, reviving gains for equity indices. The core PCE price index, along with the personal spending and income reports, are up for release next.
By Kate Curtis from Trader’s Way