
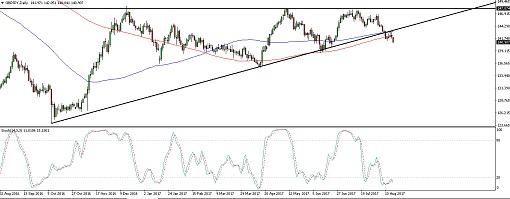
GBPJPY was previously trading inside an ascending triangle visible on its daily time frame and has just broken below support to signal that bears have gotten the upper hand. The chart pattern is around 2300 pips tall so the resulting selloff could be of the same size.
The 100 SMA is still above the longer-term 200 SMA so the path of least resistance is to the upside. However, the gap is pretty narrow so a downward crossover could be possible, drawing more sellers in the mix. Stochastic is already indicating oversold conditions, though, so profit-taking could take place.
Economic data from the UK has been mostly stronger than expected this week, with the claimant count change, average earnings index, and retail sales all coming in higher than consensus. However, CPI was still notably weak and this carries the most weight in dictating BOE policy biases.
As for the yen, the lower-yielding currency is able to gain on risk-off moves in the past few days, as well as dollar weakness on the rumored resignations among top officials in Washington. There are prevailing speculations that the Trump administration will have a hard time pushing its fiscal policy reform forward now that several GOP members are distancing themselves from the President.
Japan is still set to print its CPI readings at the end of the week and strong figures could prompt more expectations of further BOJ tapering. The central bank has already trimmed its JGB purchases in its recent operations, adding another bullish factor for the Japanese currency.
By Kate Curtis from Trader’s Way