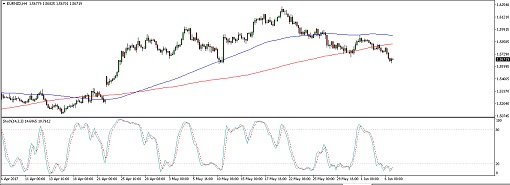
EURNZD seems to be ready to head further south as it formed a head and shoulders pattern on its 1-hour chart. Price has yet to break below the neckline at 1.5650 before confirming that further losses are in the cards.
The chart pattern is approximately 600 pips tall so the resulting breakdown could be of the same size. The 100 SMA is above the longer-term 200 SMA so the path of least resistance is to the upside.
However, the gap between the moving averages is narrowing to reflect weaker bullish pressure and a potential downward crossover. Still, stochastic is indicating oversold conditions, which means that sellers might book profits from here and let buyers regain control.
Earlier today, New Zealand reported a 0.6% gain in dairy prices during the latest GDT auction. This marks the sixth consecutive increase, which means that the dairy industry has been on a good streak for the past three months. The ANZ commodity price index in New Zealand also chalked up a 3.2% rebound over the earlier 0.2% drop.
In Europe, the upcoming snap elections in the UK is weighing on investor sentiment. Traders are also on edge ahead of the ECB decision, although the central bank might sound less dovish this time owing to another round of data improvements.
By Kate Curtis from Trader’s Way