
USDCNH broke below the bottom trend line from 6.8680 to 6.8837 of the price channel on the 4-hour chart, indicating that the short term uptrend from 6.8680 had completed at 6.9171 already. The subsequent downward movement extended to as low as 6.8683.
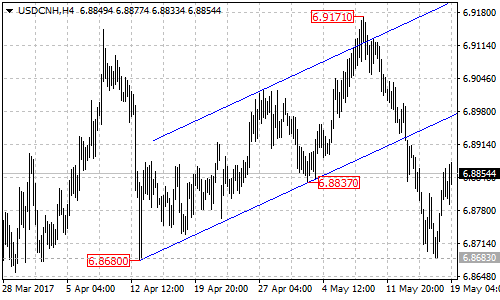
The near term resistance
The bottom support trend line of the price channel has now turned to be the resistance of the downtrend from 6.9171. As long as this pair is below the trend line, the bounce from 6.8683 could be treated as correction of the downtrend and further decline could be expected to after the correction.
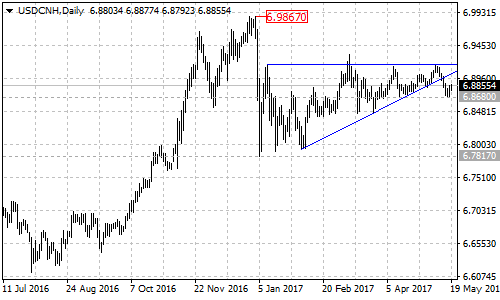
The triangle pattern
On the daily chart, the USDCNH pair broke below the lower line of the triangle pattern, indicating that the bearish movement started from the January 2017 high of 6.9867 has resumed. Further decline could be expected over the next several weeks and the pair will find support below 6.7817 January 2017 low.
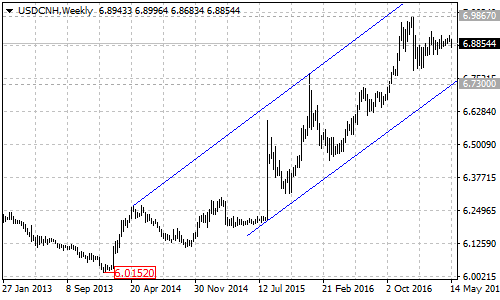
The price channel on weekly chart
On the weekly chart of USDCNH pair, there is a price channel we mentioned last week. The downside could be limited by the bottom trend line at around 6.7300.
On the upside
The key resistance is located at the upper horizontal line of the triangle pattern at around 6.9170. A clear break out of this level will indicate that the long term uptrend from the January 2014 low of 6.0152 has resumed. This could trigger another bullish movement towards 7.1200.
Technical levels
Support levels: 6.8680 (Apr 13 low), 6.7817 (Jan 5 low), 6.7300 (the bottom line of the price channel on weekly chart).
Resistance levels: The top resistance line of the triangle pattern on daily chart at around 6.9170, 6.9867 (Jan 3 high), 7.1200 (measured move target of the triangle pattern).