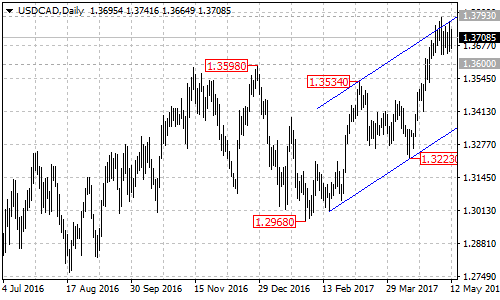
USDCAD is facing channels resistance. There is an ascending price channel on daily chart which acts as support at the bottom trend line and resistance at the top trend line. After the price touching the top trend line, USDCAD pulled back from 1.3793, indicating that the pair is under pressure by the channel resistance.
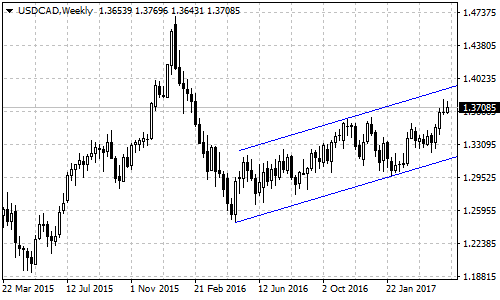
On the weekly chart, there is also an ascending price channel with resistance around 1.3900 at its top trend line.
Confirmation
The near term support level is at 1.3600. A breakdown below this level will confirm that the short term upward movement from 1.3223 had completed at 1.3793 already, then the following downward movement could bring price back towards the bottom of the price channel on daily chart.
Targets
The first bearish target would be at the bottom of the price channel on daily chart, now at 1.3330. The second target would be at the bottom of the price channel on weekly chart which is around 1.3150.
On the upside
Attention should be taken by 1.3600 support. As long as the pair is above this level, the fall from 1.3793 could be treated as consolidation of the short term uptrend from 1.3223, and another rise toward the top of the channel on weekly chart could be expected after the consolidation.
Technical levels
Support levels: 1.3600 (near term support), 1.3330 (the bottom of the price channel on daily chart), 1.3150 (the bottom of the price channel on weekly chart).
Resistance levels: 1.3793 (the high of the upward movement from 1.2968), 1.3900 (the top trend line of the price channel on weekly chart).