
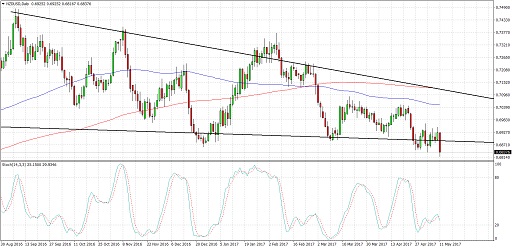
NZDUSD has been trading inside what appears to be a falling wedge pattern on its daily chart. Price is currently testing support and seems to be pushing for a break lower, indicating that a steeper selloff is about to happen. Stochastic has made it out of the overbought zone to suggest a return in buying pressure, but the oscillator appears to be having difficulty sustaining its climb.
This wedge formation is approximately 600 pips tall so the resulting downtrend could be of the same size. The 100 SMA is below the longer-term 200 SMA on the daily chart so the path of least resistance is to the downside. Also, the 200 SMA lines up with the wedge resistance, adding to its strength as a ceiling in case the pair bounces back up.
A few hours back, the RBNZ made its interest rate decision and announced that it would be keeping rates unchanged at 1.75% as expected. The actual statement was not as upbeat as many expected, leading the Kiwi to tumble across the board. Policymakers also highlighted several uncertainties and gave no indication that they’re looking to hike soon.
Meanwhile, the dollar has enjoyed some support from mostly upbeat US medium-tier reports and hawkish Fed rhetoric. Rosengren reiterated his view that three more rate hikes seem reasonable this year and even though he’s not a voting member, US markets and bond yields closed mostly higher on these remarks.
Up ahead, US PPI and initial jobless claims are due but the bigger market-movers for the dollar might be the retail sales and CPI reports due on Friday. Only the Business NZ manufacturing index is lined up from New Zealand for the rest of the trading week but quarterly retail sales reports due over the weekend could lead to gaps in the next trading week.
By Kate Curtis from Trader’s Way