
NZDUSD found temporary support and has bounced higher on April 12/2017. At this moment, bias remains bullish and we expect the pair to continue higher in the coming trading sessions. Bulls will be waiting on any pullbacks to push the pair higher.
NZDUSD 1 Hour Chart Bullish Patterns: The blue bullish pattern has already triggered a buy at the XA 0.886% Fib. retracement level and has pushed the pair higher. Another bullish pattern (Red) is also visible and has yet to trigger buys. Traders should wait for NZDUSD to terminate point C (red) then look for buying opportunities on the pullback lower of the point D (red). Expect for the red point D to terminate at the red BC 0.50% Fib. retracement level but traders need to wait and see where the point C (red) terminates.
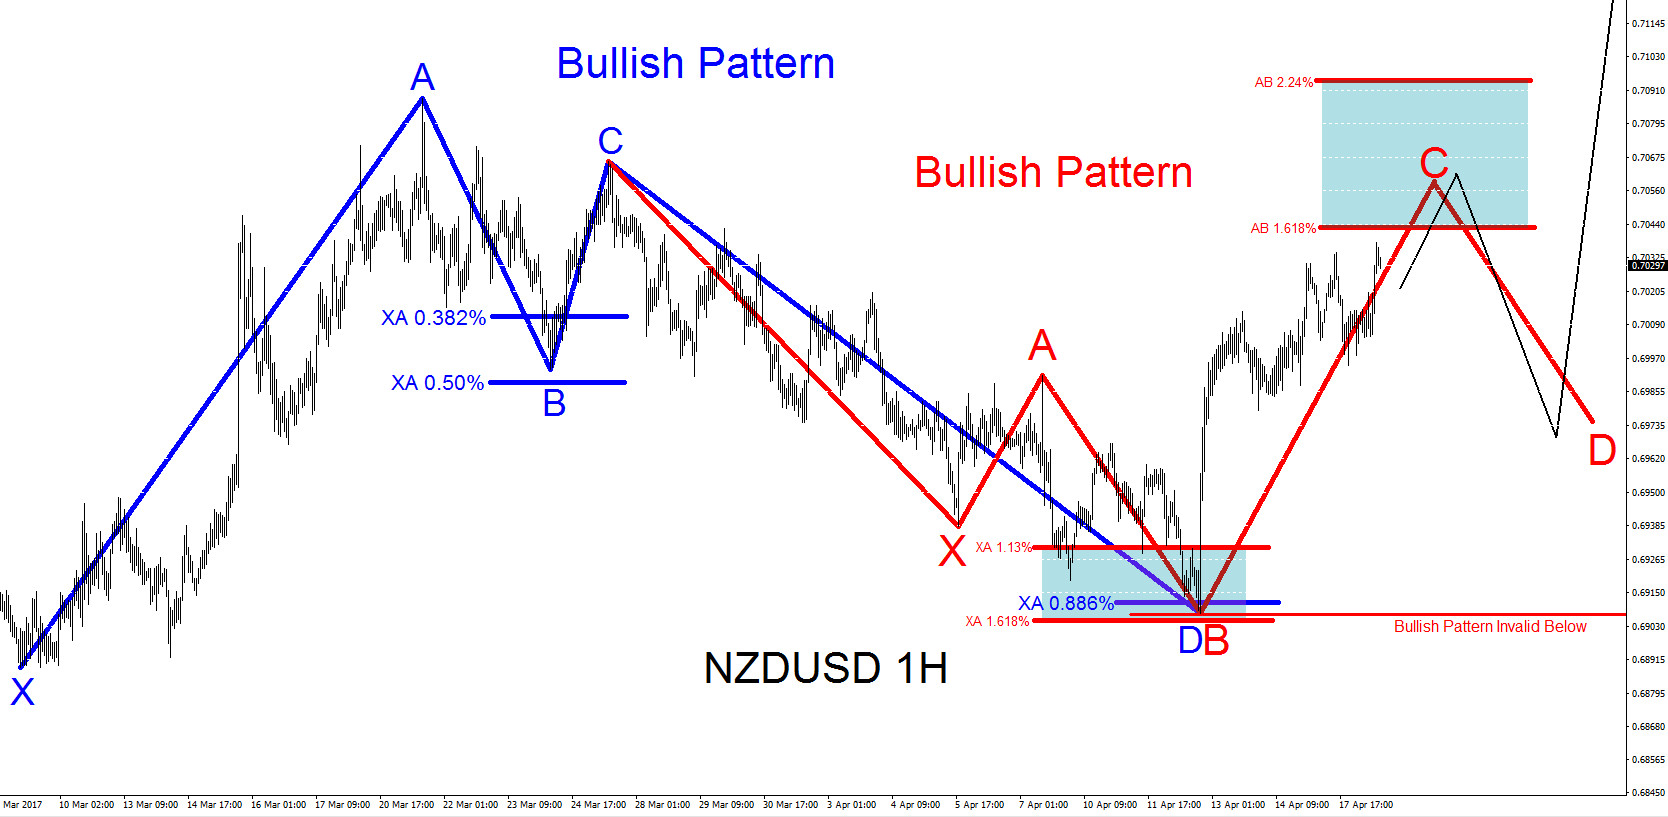
If looking to buy NZDUSD traders should be patient and wait for price to make a move lower to the possible point D red BC 0.50% Fib. retracement level. Waiting for price to move below the red BC 0.50% Fib. retracement will offer a better risk/reward trade setup. Red bullish pattern is invalidated if price moves below point B of the pattern and take profit levels should be above the blue pattern point A.
Of course, like any strategy/technique, there will be times when the strategy/technique fails so proper money/risk management should always be used on every trade.
Source : https://elliottwave-forecast.com/aidans-corner/nzdusd-technical-analysis-april-182017