
One of the most popular consensus in 2017 among the analysts is a stronger U.S. Dollar due to the Fed in rate hiking cycle and also Donald Trump promising infrastructure spending, tax reform, which are all supposedly US Dollar positive. At Elliottwave Forecast, we listen to the market through our technical analysis using Elliott Wave, cycle and distribution instead of going with the popular belief.
The US Dollar Index declined during the recent 2 weeks despite the fact that US Federal Reserve raised the interest rates by 0.25% On Wednesday 03/15/2017. Yesterday USDX managed to break below January low , so let’s take a look how we managed to forecast the move lower using the Elliott Wave Theory .
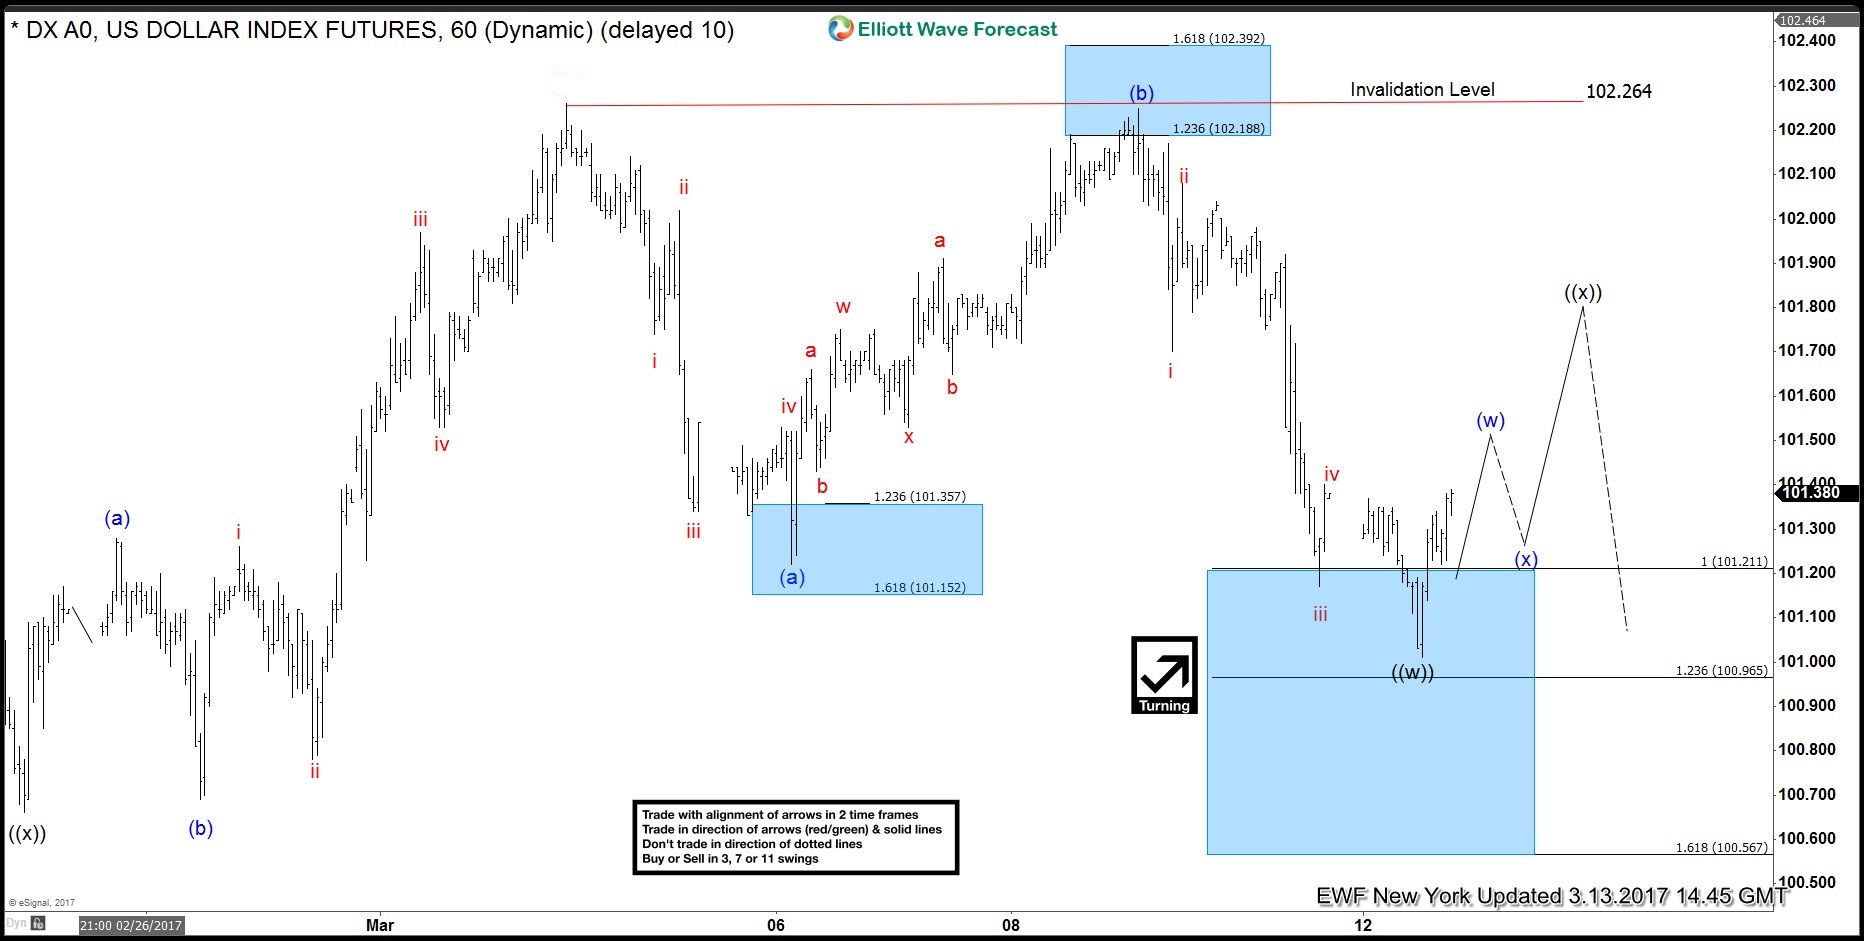
On the weekend before the FOMC meeting , we were looking for the US dollar to bounce early in the week before it can find sellers again and resume lower. So looking at 1H chart on 03/13 , USDX has already ended 3 waves move in wave ((w)) from 03/02 peak at equal legs area 101.21 – 100.96 and it was expected to bounce in 3 swings higher in wave ((x)).
US Dollar 1H New York Chart 03.13.2017
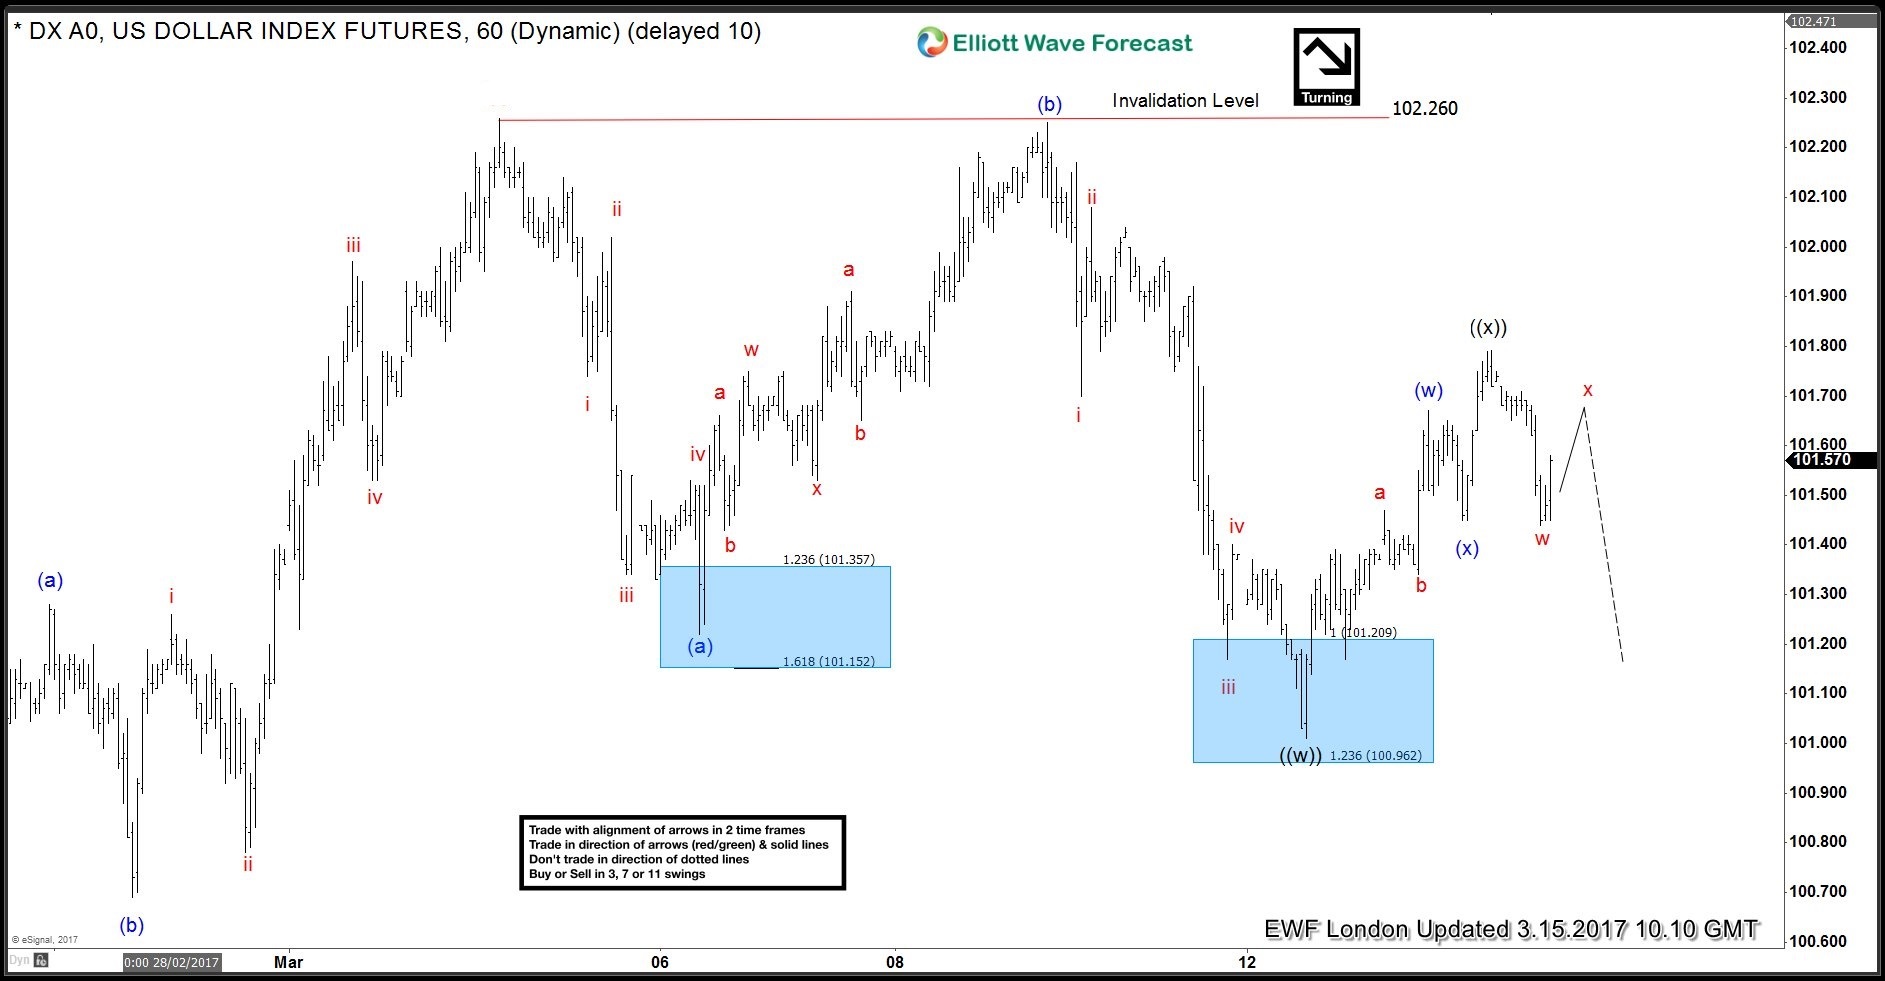
The bounce higher happened as expected and already ended in wave ((x)) in the night before the FED decision, so during the London update on 03/15 we were looking for the US Dollar to hold below 03/14 peak and trade to the downside no matter what was the result as we believe that the technical aspect of the market is more important and effective for trading which can give you an edge during these kind of event .
US Dollar 1H London Chart 03.15.2017
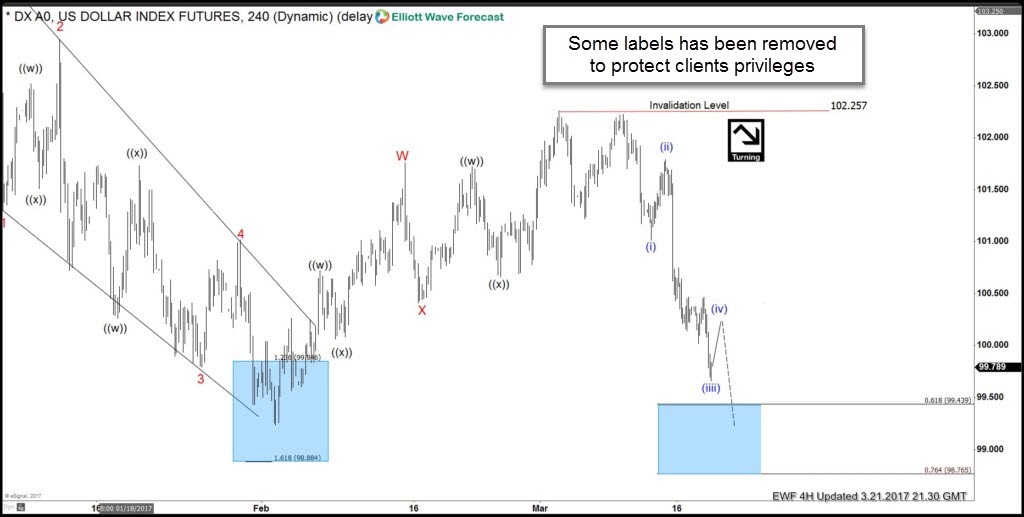
After the announcement , the US Dollar traded lower as expected and kept extending to the downside creating an impulsive bearish sequence that’s why we kept pushing to the downside as showing in the 4H chart on 03/21 . USDX was looking to reach the 61.8 – 76.4 Fibonacci extension of the 2 legs from January 2016 peak which will make it ideally break 02/02 low that’s why it wasn’t recommend to buy the dollar during that stage .
US Dollar 4H Chart 03.21.2017
Source : https://elliottwave-forecast.com/video-blog/us-dollar-elliott-wave-decline